All About Mulanje
Basic Information about Mulanje
| Land Area (km2) | 2,056km2 (Ranking No.19 / 28 districts) |
|---|---|
| Population | 684,107 (Ranking No.11 / 28 districts) |
| Population Density | 333/km2 (Ranking No.6 / 28 districts) |
| Literacy Rate | 69.41% (Ranking No.13 / 28 districts) |
| Electrification Rate | 6.41% (Ranking No.17 / 28 districts) |
| Water pipe Rate | 8.83% (Ranking No.8 / 28 districts) |
*The data is as of 2018.
Mulanje was originally known as ‘Fort Anderson’.
It was one of two British forts built in the region to control the Yao slave trade to Mozambique via the Fort Lister Gap.
The original Fort Anderson was built in 1893 about 20km away from the present-day town, but it was relocated there after three years.
Fort Anderson was renamed Mlanje in 1907 and this was later corrected to the more accurate spelling “Mulanje”.
The town is situated along the M2 highway from Thyolo to the west with the Mozambican border to the east.
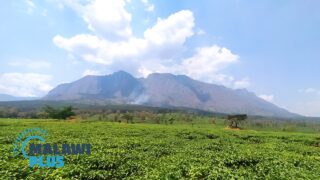
It is famous for both its spacious and green tea plantations and the achingly pretty Mulanje Massif which is the tallest mountain (3,002m) in south-central Africa.

The upper plateau which is serviced by ten well-maintained huts, offers some of the most rewarding hiking opportunities in the country, while the peaks are renowned for their rock climbing.
The town is also an important gateway for overland travel to/from Mozambique, situated about 16km from the Muloza/Mulanje border post at the southeast base of the Mulanje Massif.
The town comprises of two distinct parts.
If you are coming from the direction of Blantyre, you first arrive at Chitakale, which is the main commercial centre and the most popular base for climbing Mulanje.
The older administrative part of Mulanje is home to most of its smarter hotels and it lies about 1.2km further east and it is reached by following a flame-tree-lined stretch of the M2 that bisects Chitakale Tea Estate.
Mulanje Population by Tribe
| Tribe | Lomwe | Mang’anja | Yao | Chewa | Others |
| Percentage | 82.77% | 11.02% | 3.77% | 0.69% | 1.75% |
*The data is as of 2018.
Mulanje Population by Religion
| Religion | Christian | Islam | Others | No Religion |
| Percentage | 88.03% | 5.57% | 5.46% | 0.94% |
*The data is as of 2018.
Accommodations in Mulanje

Tourist Attractions in Mulanje
